
Measure
Demand / capacity / TAT / equipment / quality / productivity / costAnalytical Performance System
How do we keep laboratory performance under control after the project ends?
The Analytical Performance System gives management ongoing visibility of whether the laboratory continues to meet the requirements of the operation.
Client situation
When it is needed
For laboratories requiring consistent control of turnaround, capacity, productivity, equipment, quality, cost and emerging operational risk.
Management loop
Turn operating information into management action.
Identify exception
What changed?Understand cause
Why did it change?Act
What intervention is required?Verify
Did performance recover?Verify ↺ Measure
The dashboard is not the product.
The management loop is the product.
One operating system
What Sirius examines
- 01Demand
- 02Capacity
- 03Flow
- 04Turnaround
- 05Productivity
- 06Equipment
- 07Quality
- 08Cost
- 09Risk
- 10Action
The purpose is not to create another dashboard. It is to establish a repeatable management system that makes deterioration visible early and helps management act on the right issues.
Evidence base
Typical evidence reviewed
- Sample demand
- Backlog
- Turnaround compliance
- Reportable output
- Direct production hours
- Productivity
- Equipment availability
- Downtime
- Utilisation
- Reruns and reprocessing
- QA/QC performance
- Cost per reportable sample
- Maintenance indicators
- Staffing and shift performance
- Safety indicators
The work
What Sirius does
- 01
Define what matters
Identify the outputs and service levels that matter to the operation.
- 02
Establish the baseline
Set realistic reference points for capacity, turnaround, quality and productivity.
- 03
Select decision-relevant indicators
Use only measures that help management understand performance or trigger action.
- 04
Build the management view
Connect demand, flow, people, equipment, quality and cost into one picture.
- 05
Establish review routines
Create a repeatable process for reviewing results, investigating deviations and assigning actions.
- 06
Track improvement
Measure whether interventions actually change performance.
Management review
Core management questions
What changed?Why did it change?Where was capacity lost?Is the problem temporary or structural?What risk is developing?What action is required?
Decision support
What the client receives
- Defined laboratory KPI framework
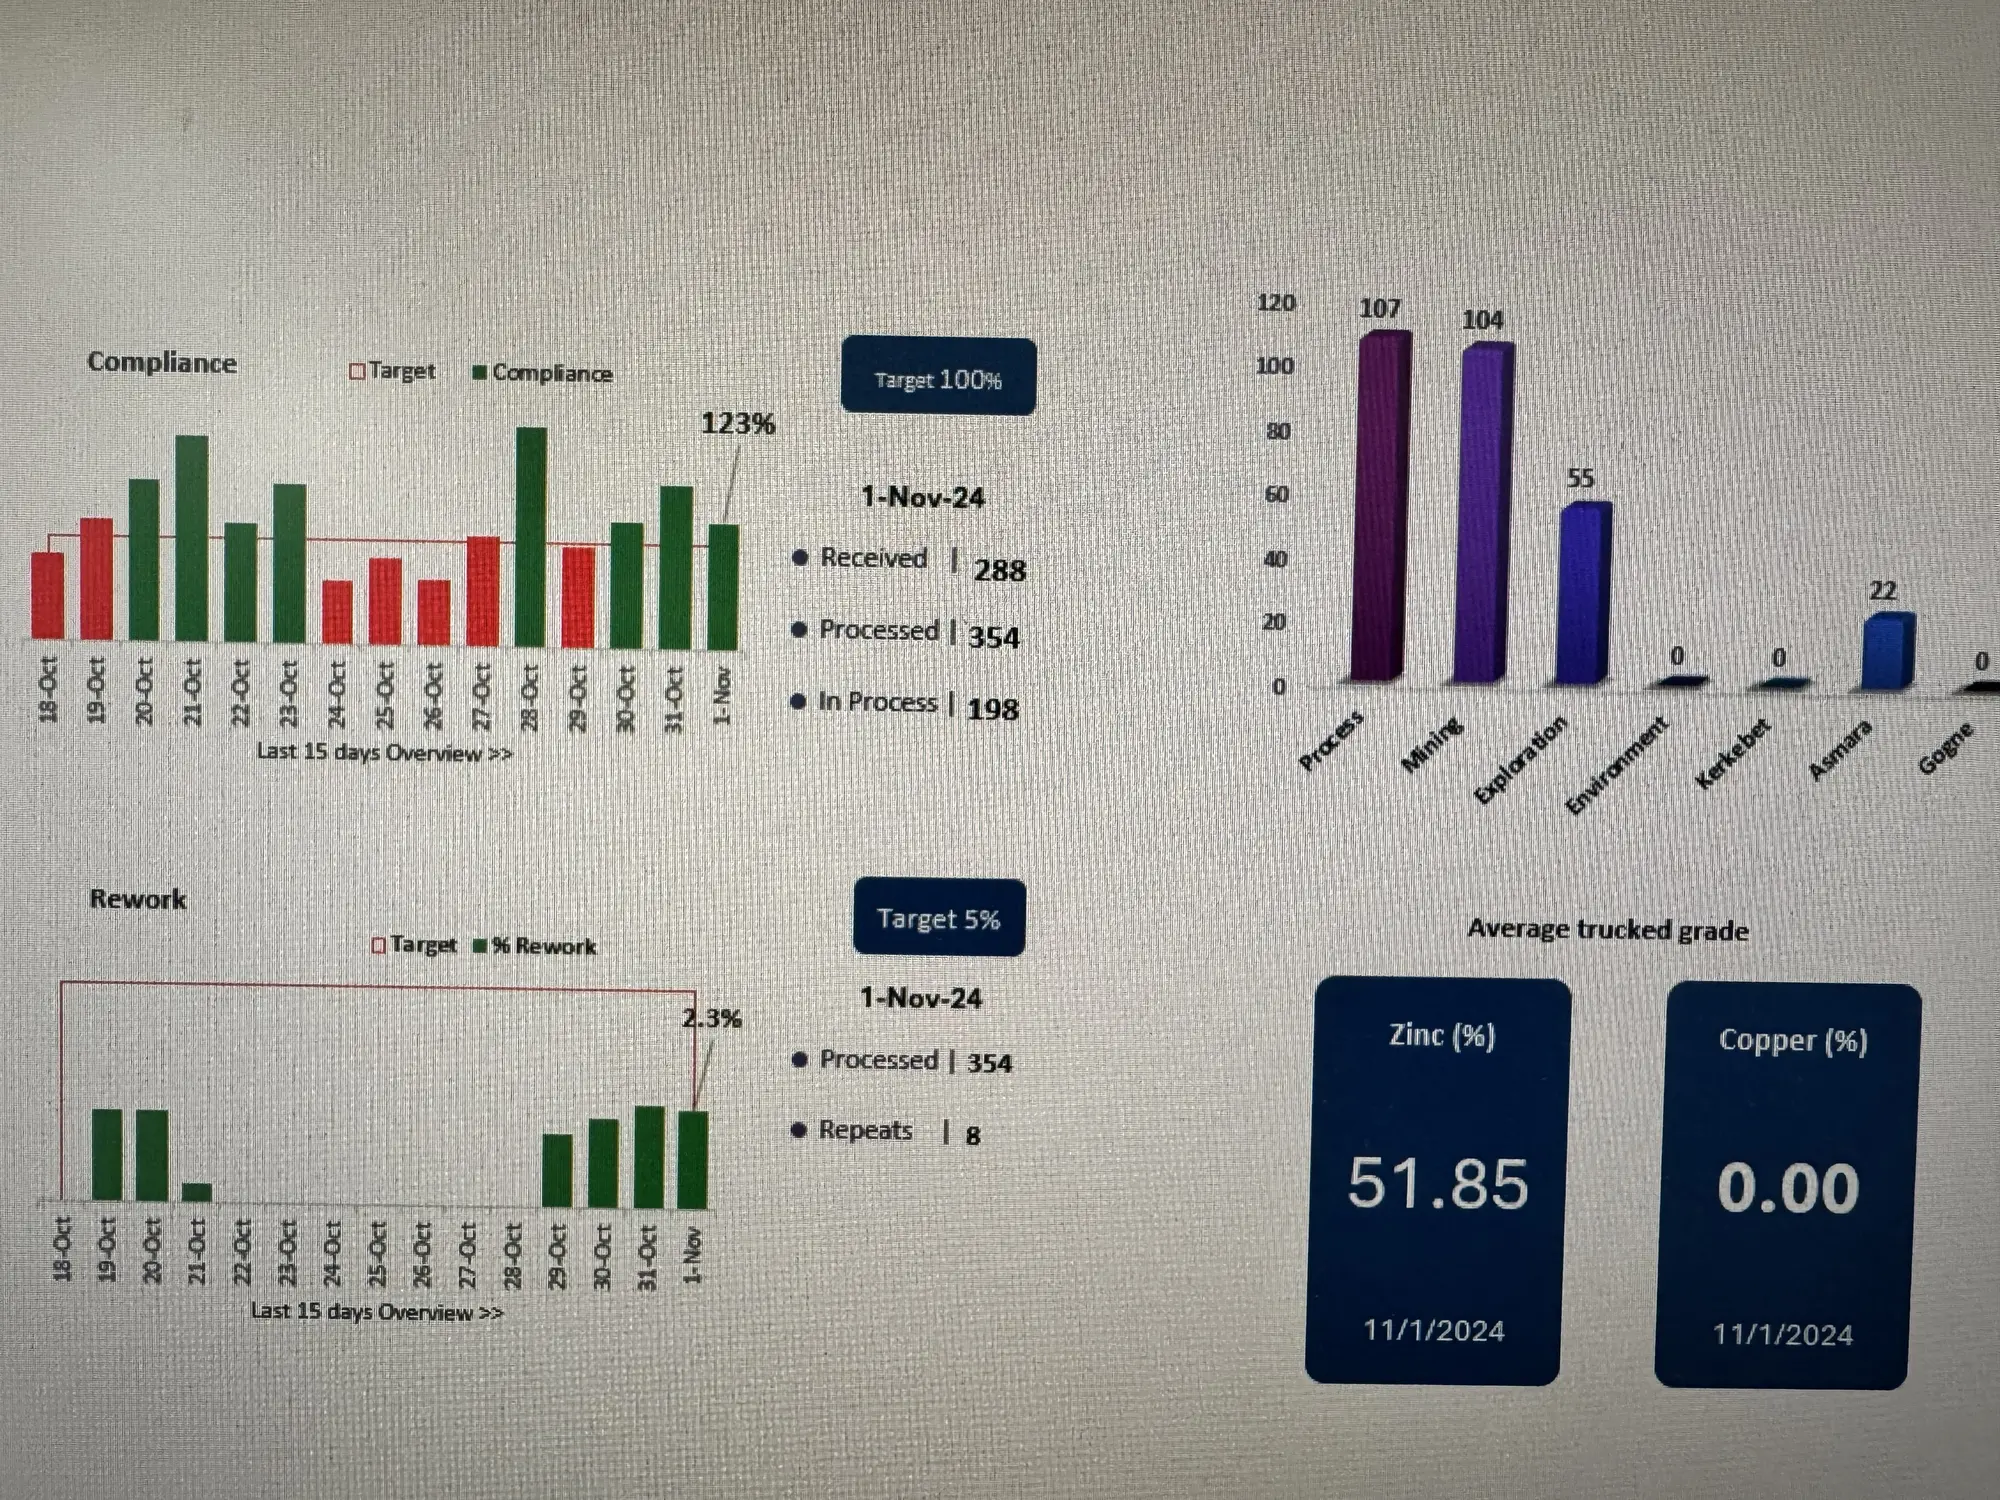
- Performance dashboard
- Baseline and targets
- Capacity and turnaround visibility
- Equipment-performance view
- Quality-performance view
- Productivity and cost visibility
- Management review structure
- Action and accountability tracking
- Periodic Sirius performance review where agreed
The value lies in creating a consistent operating rhythm rather than producing one-off reports.
Illustrative only
Example output
All numerical values are illustrative — not Sirius project evidence.
Demand
6,300 samples
Capacity
6,800 sustainable
Performance
TAT compliance — 87%
Backlog — 420
Equipment availability — 91%
Rework — 2.8%
Productivity — 4.6 reportable samples/direct hour
Backlog — 420
Equipment availability — 91%
Rework — 2.8%
Productivity — 4.6 reportable samples/direct hour
Exception
Critical equipment availability falls
Operational effect
Backlog increases and TAT deteriorates
Management action
Maintenance intervention + workload reallocation
Follow-up
Measure whether backlog and turnaround recover
The dashboard is not the product. The management loop is the product.
Product routing
When this product leads to another product
Persistent performance problemLaboratory Performance Diagnostic
Emerging capacity gapCapacity & Resource Model
Network issueLaboratory Network & Operating Model
Major implementation requirementBuild, Transition & Operate
Next step